
SIH 2026 / Renewable & sustainable energy
Bioenergy,
made observable.
A plant has a history. Every decision should too. GFIS EcoTwin brings reactor records, model comparison and visible process simulation into one engineering workspace.
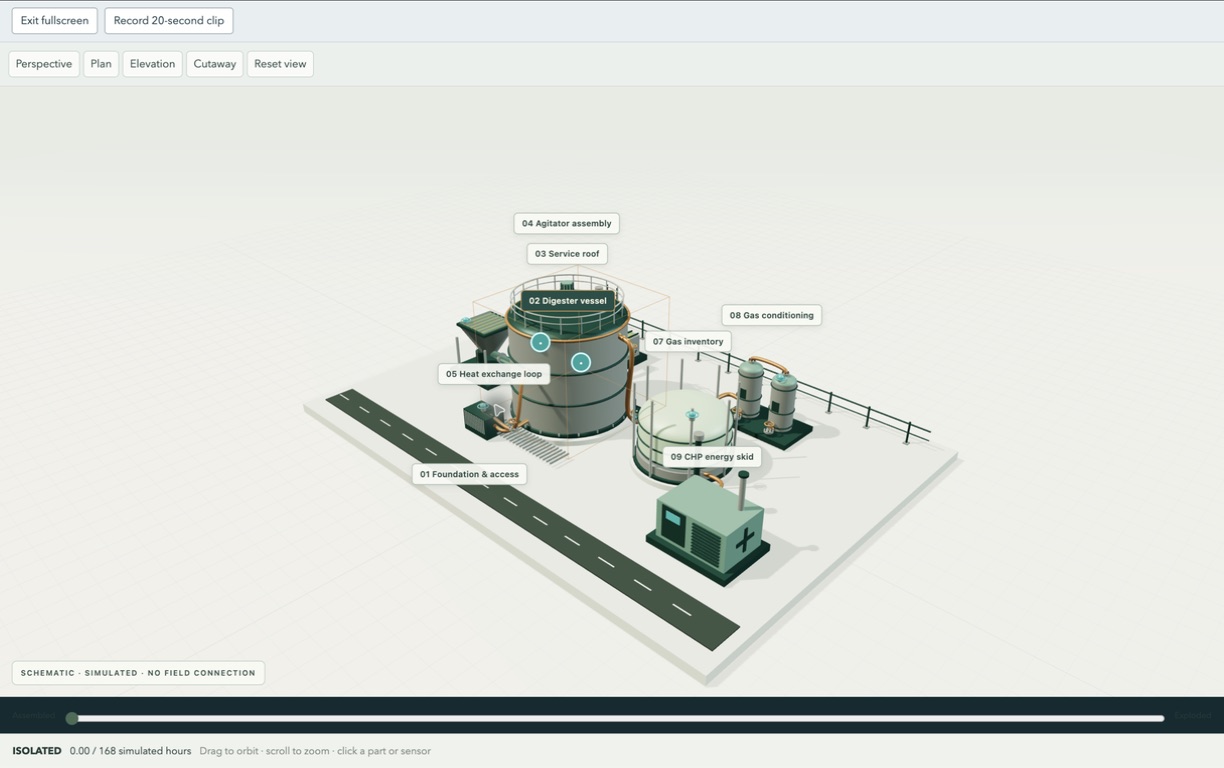
The working environment
Explore the plant.
Follow the evidence.
Measured reactor histories and synthetic scenarios serve different purposes. Each view keeps the source, units and limits visible.
01 / Replay laboratory
The record behind
the reading.
Move through reactor history, compare previous-record persistence and inspect the reason behind a screening alert. Save and export an event for review.
Open replay & scenario controls ↗Retained public observations. Scenario outputs are synthetic. Event memory in this SIH lab is browser-local.
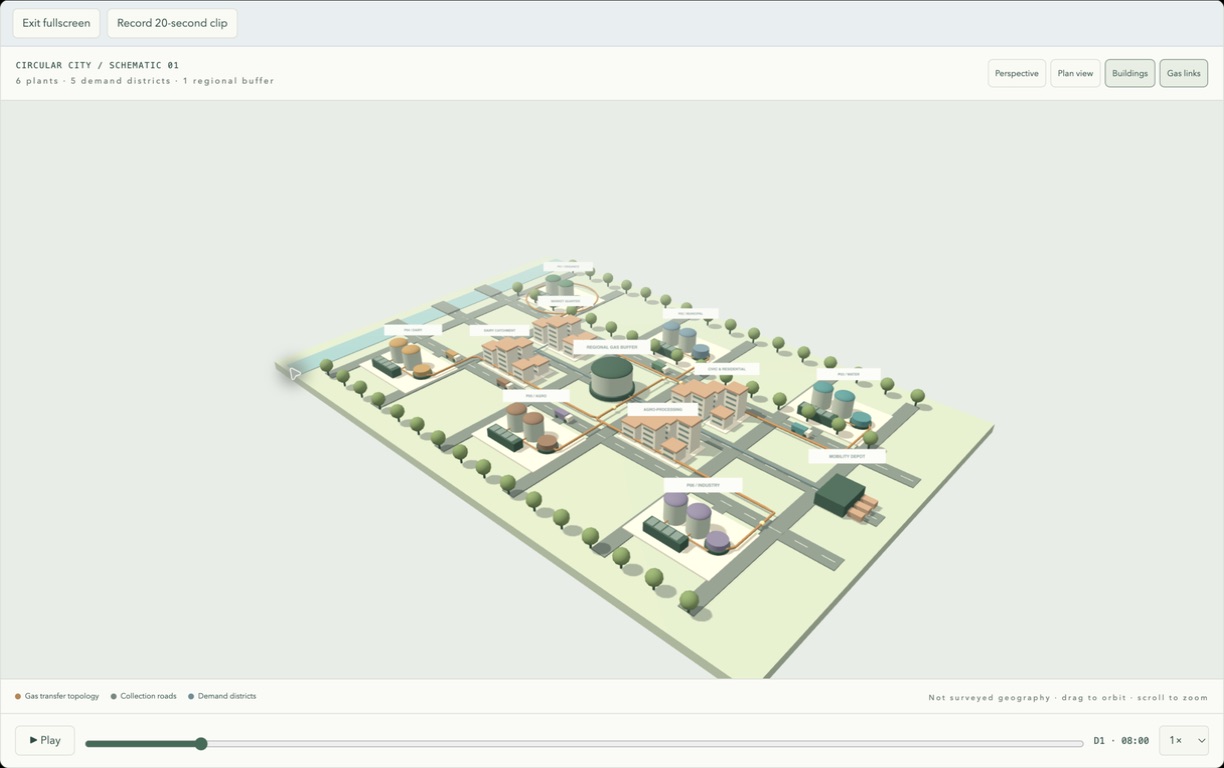
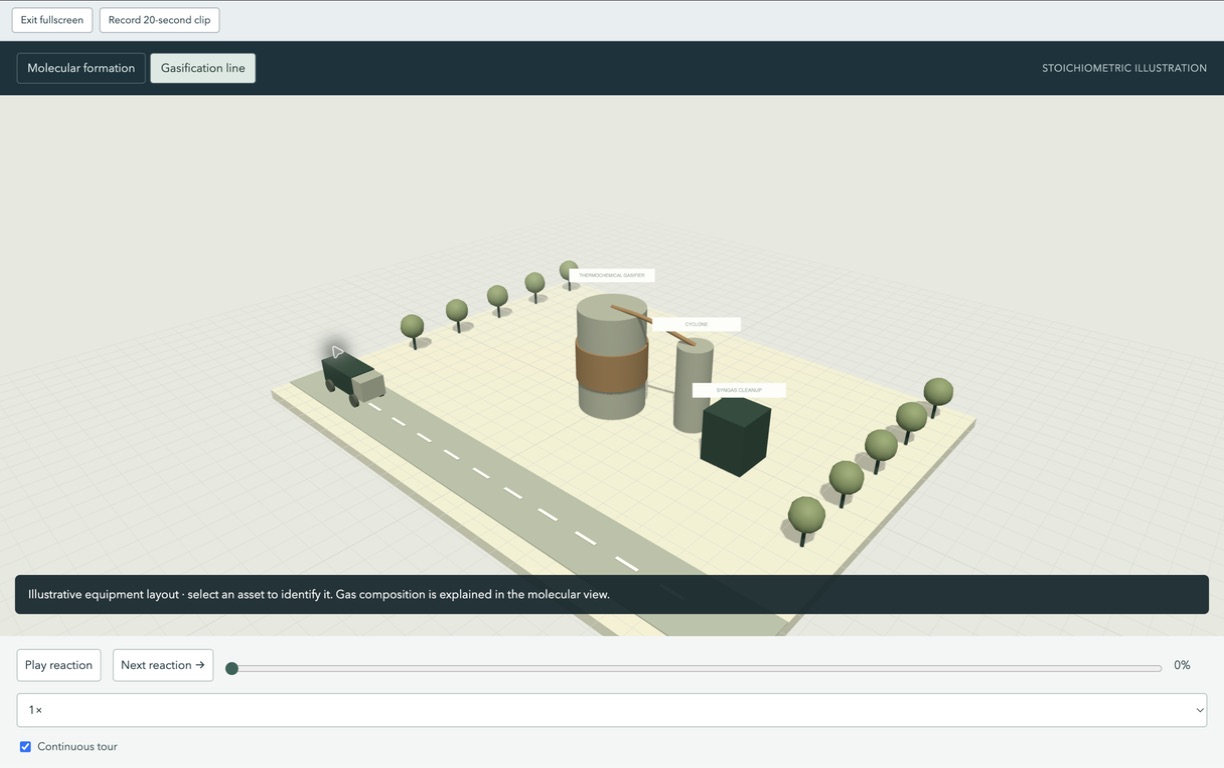
Explainable engineering
Nothing useful
ends at a number.
The research compares prediction methods. The simulator explores declared scenarios. Student development connects traceable sensor packets to visible plant state.
- 01 / INPUT
Establish the source
Retain reactor identity, timestamp, target meaning, units and missing-data flags.
- 02 / MODEL
Compare fairly
Evaluate persistence, XGBoost and LSTM with chronological separation and train-only transforms.
- 03 / SIMULATE
Inspect the response
Explore a synthetic 48-hour horizon. Check the gas balance, storage limits and scenario assumptions.
- 04 / REVIEW
Keep the reasoning
Retain inputs, outputs and event context so another student can reproduce the demonstration.
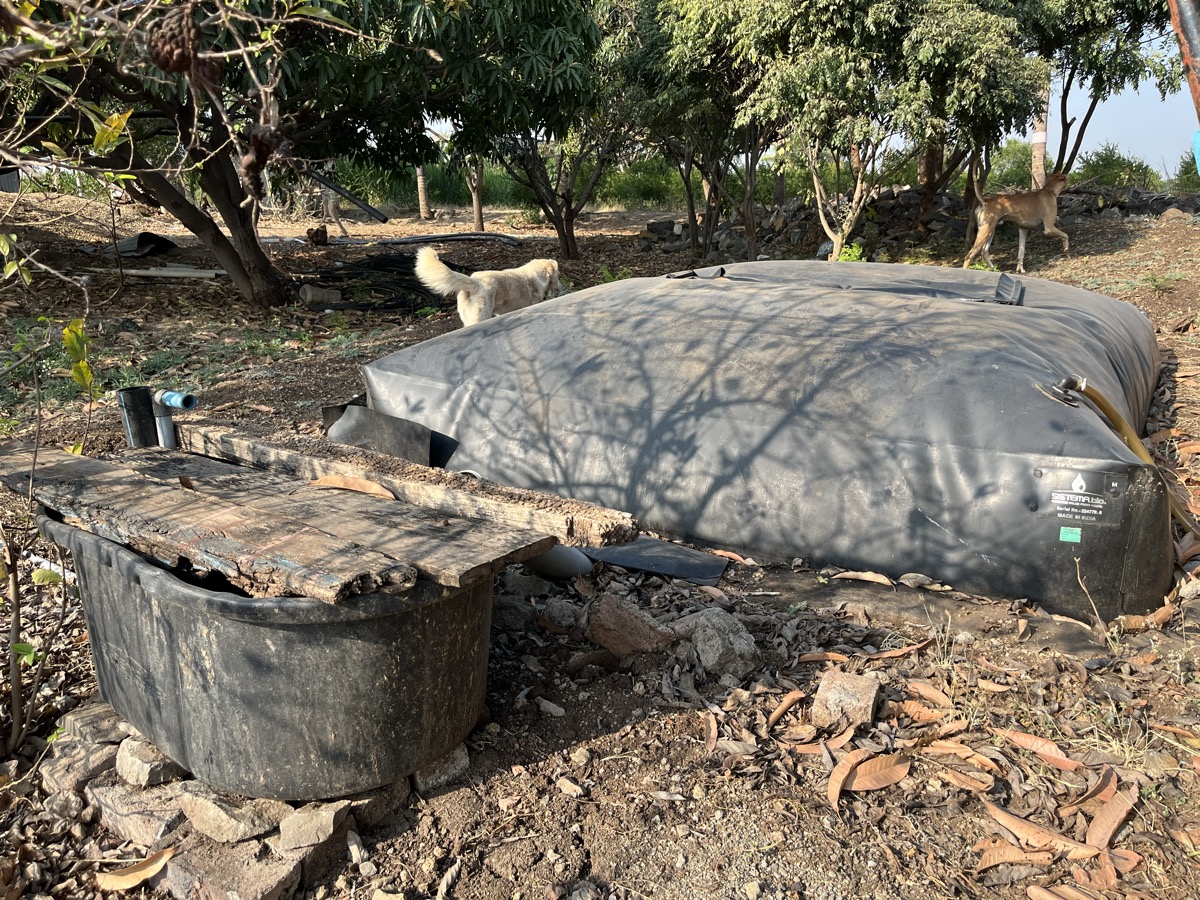
The field context
A real installation.
A defined next step.
The farm gives the team a physical setting for equipment inventory and supervised observation. The software already provides a place to test scenarios and inspect records.
The student prototype work covers the telemetry schema, ROS2 adapter, asset-state mapping and fault testing. Connecting and calibrating the farm remains a separate supervised milestone.
Read the telemetry bench plan ↗Shri Siddheshwar Women’s Polytechnic, Solapur
Six students.
A shared engineering task.
Led by Vijayalaxmi Kalidas Sundalam, the team extends the GFIS research foundation through software integration, ROS2 visualisation and repeatable tests.
Meet the team & view responsibilities ↗Vijayalaxmi + Sakshi
Integration, system concept and ROS2 replay.
Sunaina + Sneha
Model explanation, 3D assets and city workflow.
Samina + Shweta
Sensor packets, fault tests and alert memory.
Industry mentor
Akash Shivadas Chatake
Chatake Innoworks Private Limited
College guide
Prof. N. K. Mane
HOD, CO Department
The complete project dossier
Read it. Present it.
Reproduce the workflow.
The revised six-slide presentation, technical reading guides, sponsorship documents and Marathi learning media stay together.