The full Level 1 scope
This is not a five-box handoff. It is a system of systems that begins with land, population and waste evidence; designs plants and networks; receives operational intelligence from Level 2; and produces city, state and national investment plans.
1. Geospatial site and catchment intelligence
Population and settlement
Use census-grounded population grids combined with satellite-derived buildings, land cover, roads and night-time activity. A single image must not be presented as an exact population count.
Waste supply
Estimate municipal organic waste, crop residue, livestock manure, dairy waste, sewage sludge and food-processing residue within collection radii.
Site constraints
Road access, land use, slope, flood exposure, water, grid/gas proximity, residential setbacks and protected areas become suitability layers.
Satellite evidence boundary
Satellite imagery can identify land cover, settlement expansion, crop proxies and large waste hotspots. It cannot determine household-level waste composition or biochemical methane potential without ground and laboratory data.
2. Waste intelligence through two CNN systems
Satellite/airborne CNN
- Dumpsite and landfill detection
- Land-use and surface-change classification
- Large waste hotspot and transfer-site monitoring
- Crop/vegetation proxies for residue planning
Ground-camera CNN
- Organic/plastic/paper/metal classification
- Contamination and foreign-object detection
- Vehicle or conveyor load inspection
- Feedstock-quality score linked to sampling
3. Plant, hub and network design
| Decision | GFIS evaluates | Output |
|---|---|---|
| Plant capacity | Reliable feedstock, collection radius, TS/VS/BMP, seasonal availability and utilisation | Tonnes/day, reactor size and predicted methane |
| Hub structure | Village clusters, transport distance, upgrading/compression scale and redundancy | Plant-to-hub allocation and shared assets |
| Energy route | On-site CHP/heat, biogas use, CBG, CGD injection, cascade or short gathering pipeline | Least-cost feasible dispatch route |
| Gas logistics | Production density, distance, pressure, storage, vehicle/pipeline cost and safety | Pipeline, cascade or local-use recommendation |
| Control hierarchy | Alarm criticality, data latency, autonomy and connectivity resilience | Plant/district/region/state/national responsibility |
Not every plant should be physically connected by pipeline
All plants can be digitally connected. Physical gas connection is selected only where density, distance, production continuity, upgrading route and safety economics justify a cluster pipeline or injection hub.
4. City-to-national control architecture
Production forecasts, data quality and alarms travel upward. Approved planning envelopes and dispatch schedules travel downward. Safety-critical plant control remains local even when cloud connectivity fails.
5. Plant-wise capacity and energy model
Daily
Waste received, methane/biogas, CBG, electricity, heat, uptime, flaring, methane slip and energy use.
Monthly and annual
Predicted vs actual production, seasonal feedstock, downtime, maintenance, revenue, cost and carbon performance.
Plant portfolio
Capacity, utilisation, reliability, warning burden, logistics and investment status across every plant and hub.
6. Complete project cost and 30-year expansion
Capital and lifecycle cost
- Land, civil works and digesters
- Preprocessing, upgrading and compression
- Storage, CHP/injection and gas logistics
- Digestate, IoT, SCADA and control rooms
- Engineering, approvals, contingency and replacements
Revenue and savings
- CBG, electricity and usable heat
- Waste/tipping fees and avoided disposal
- Digestate/fertiliser value
- Avoided fossil-energy purchases
- Verified carbon/methane-abatement value
The financial engine will calculate P10/P50/P90 pre-feasibility ranges, NPV, IRR, payback, DSCR, levelised CBG cost and sensitivities to yield, feedstock, downtime, price, distance and financing. A bankable DPR still requires plant-specific surveys, contracts, vendor quotations and approvals.
7. Reports and proposals produced by GFIS
Single plant
Site score, design basis, capacity, predicted production, 3D plant/twin design, equipment, CAPEX/OPEX and risk.
City or district
Waste atlas, plant clusters, collection routes, hubs, energy balance, cost saving and control-room design.
State and country
Capacity database, expansion phases, investment, gas/energy corridors, emissions, policy KPIs and 30-year roadmap.
GFIS 30+ complete proposal package
Executive proposal · 3D plant and IoT architecture · GIS site-selection atlas · CNN waste methodology · plant-wise capacity database · gas/pipeline/cascade logistics · control-room hierarchy · cybersecurity/governance · 30-year techno-economic model · emissions analysis · pilot DPR · phased national roadmap.
Development sequence: build one truthful system before national scale
Scientific GFIS engine
Methane/stability validation, physics-loss ablation, data provenance and evidence memory.
One 3D virtual plant
Software-in-the-loop telemetry, equipment state, alarms, historian and Control Room.
One city/district
Real GIS layers, ground waste samples, candidate plants, routes, hubs and pre-feasibility economics.
Regional/state network
Fleet intelligence, shared infrastructure, dispatch, maintenance and programme control.
National planning twin
Phased capacity, investment, resilience, gas/energy network and policy scenarios.
Evidence before expansion
Every scale-up assumption must retain source, uncertainty, model version and validation status.
Existing Level 1 work remains the foundation
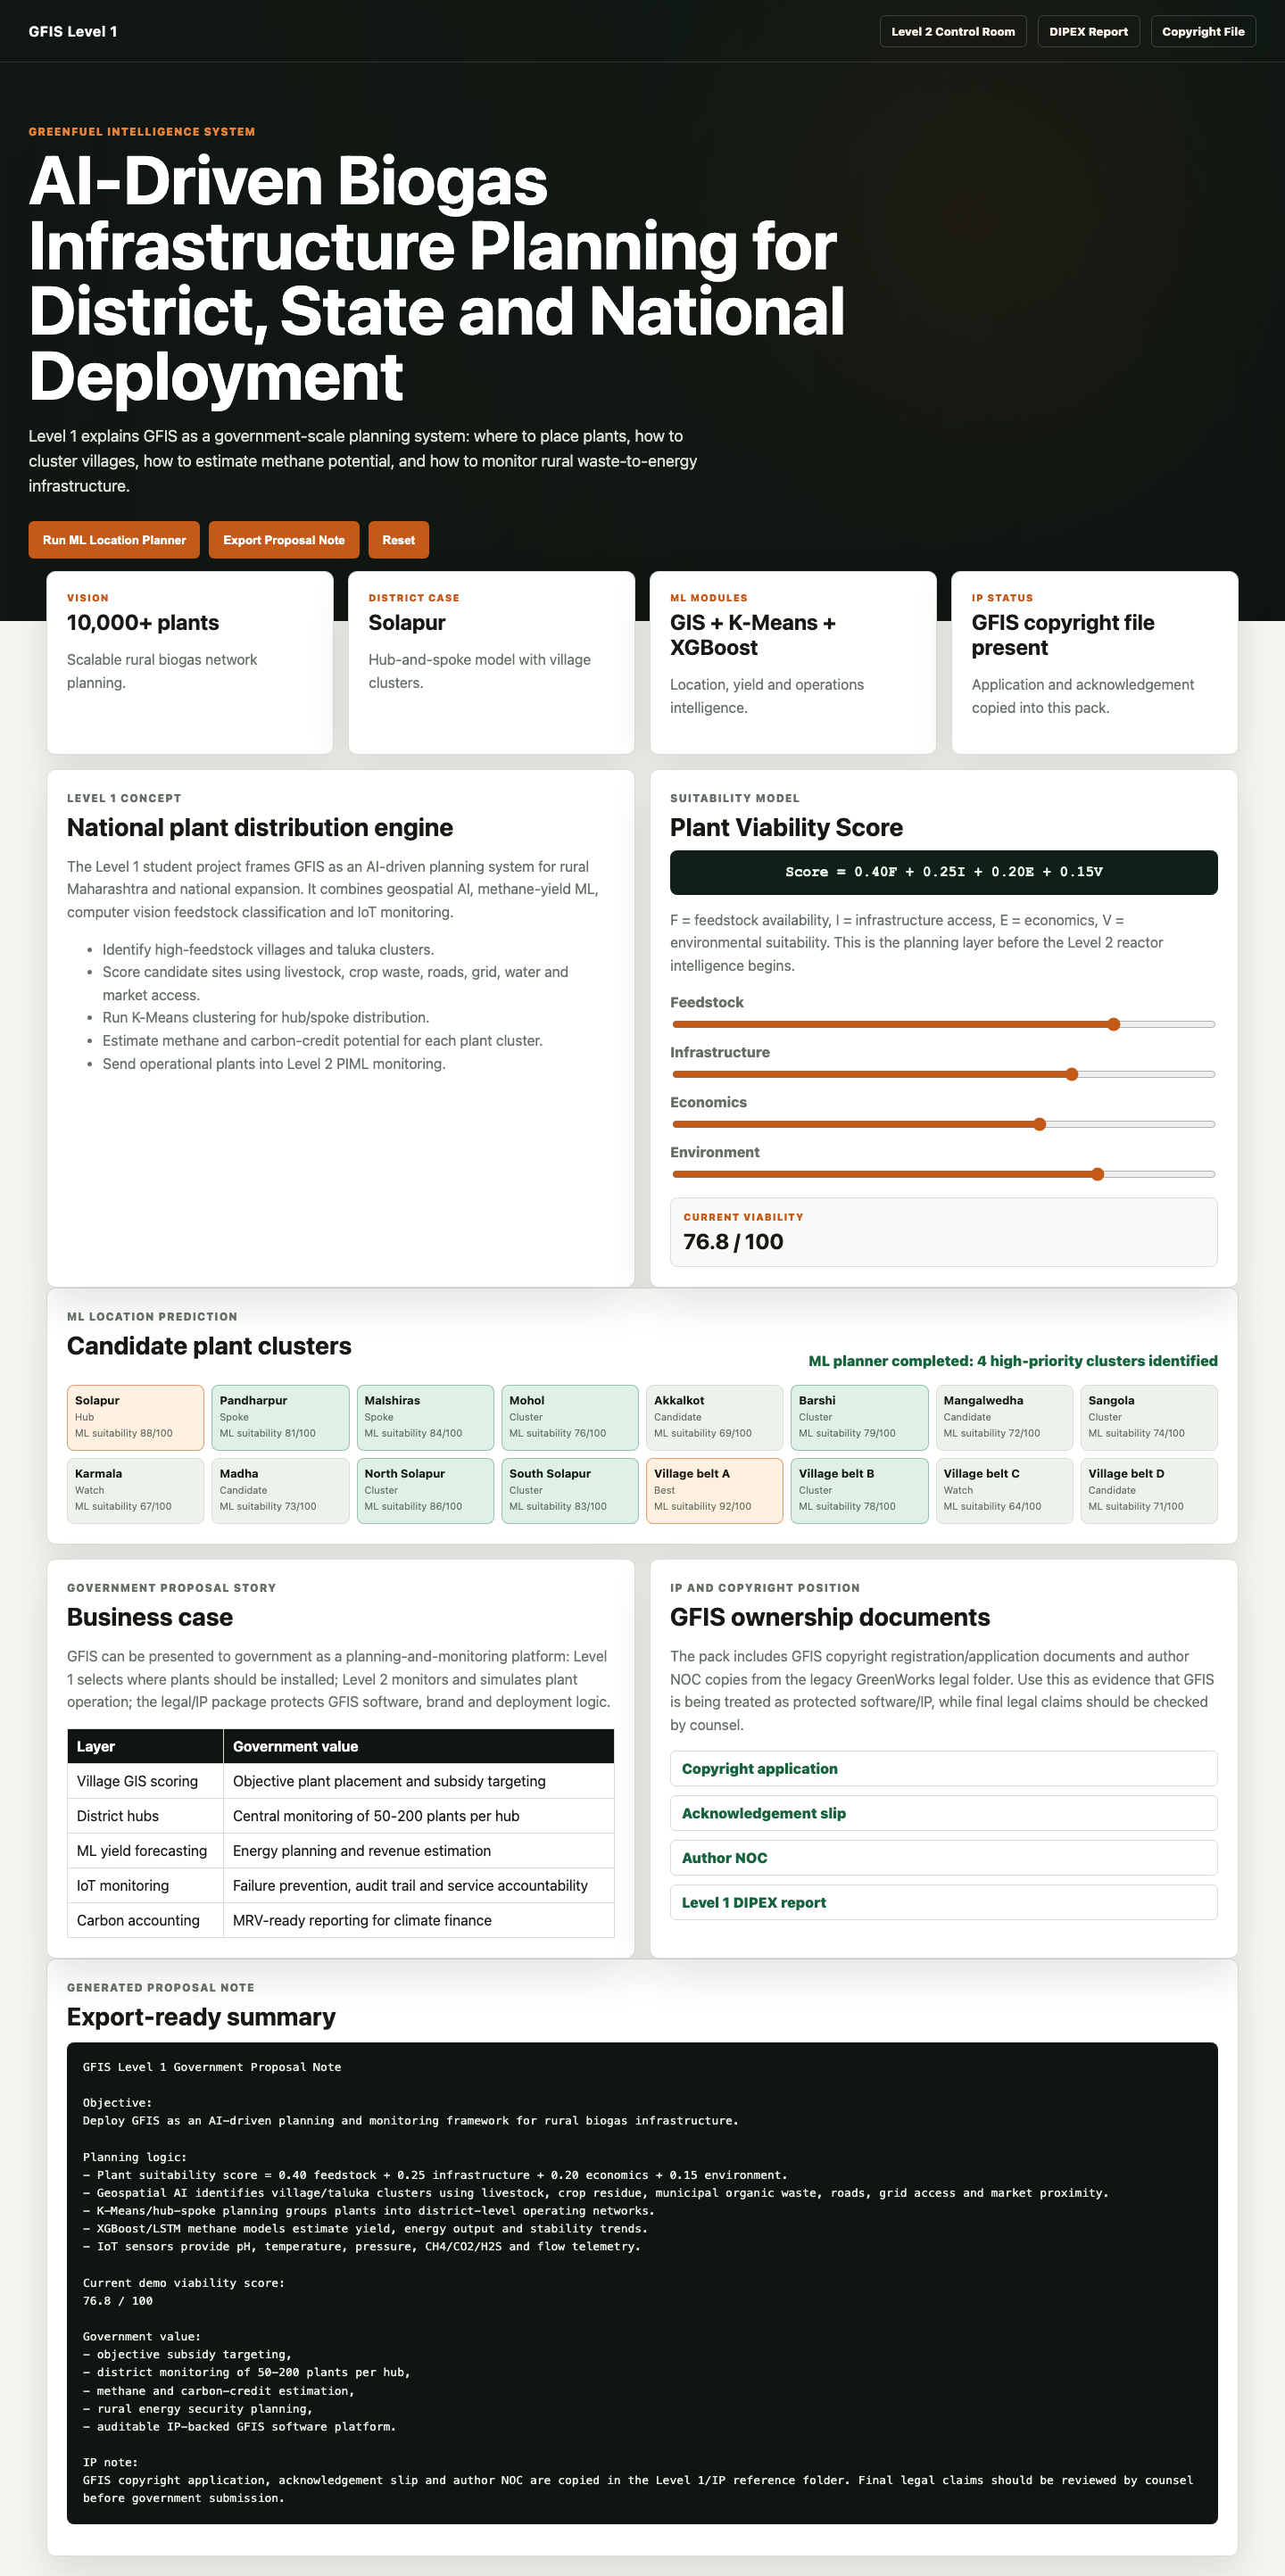
Existing Level 1 planning interface and government proposal workbench. GFIS 30+ expands this foundation into geospatial, waste, plant-network and long-horizon infrastructure intelligence.
Open current Level 1 workbench Open DIPEX project report Open 3D plant architecture